

17Aug, 2022
Applying a Hotfix to Correct xConnect Bugs Doesn't Always Mean You're Finished
While supporting a Sitecore Managed Cloud environment, I had to apply a patch to resolve DeviceProfile conflict exceptions. The errors cleared up nicely, but what wasn't obvious was a new batch of errors, to the tune of 600,000+ in only a few short days. In this article I'll walk you through the steps needed to resolve the numerous “Failed to load N interactions from XConnect” errors that can come up.
How Did I Notice This?
I don't manage this instance, so the notifications being sent to certain groups weren't making it my way. A different dev team asked for help when they were preparing for a deployment since Application Insights was empty during their window of operation. You can see here there's an obvious cut-off in records.
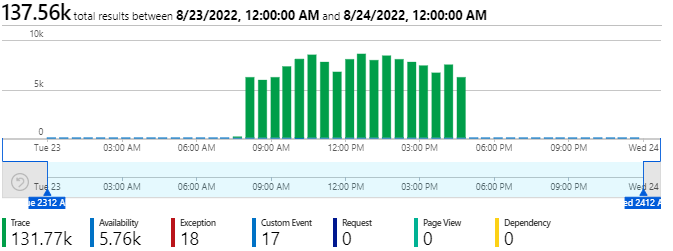
This is a classic sign the daily spending cap for Application Insights has been reached, so logs are not going to be stored until the next day begins. But what's changed? Why has the volume increased so much? Checking the history of the logs there's a significant jump in logs.

What Has Changed to Cause This Spend Increase?
As soon as I look at the logs I can see a couple repeated entries, even on the default view. When I searched for them, I saw over 300,000 each, starting at the time of the spike in volume.
WARN Failed to load 66 interactions from XConnect.

ERROR [Path Analyzer] Error during aggregation.
Exception: System.AggregateException
Message: One or more errors occurred.
Source: mscorlib
at System.Threading.Tasks.Task.ThrowIfExceptional(Boolean includeTaskCanceledExceptions)
at System.Threading.Tasks.Task.Wait(Int32 millisecondsTimeout, CancellationToken cancellationToken)
at Sitecore.PathAnalyzer.Processing.Agents.TreeAggregatorAgent.Execute()
Nested Exception
Exception: System.ArgumentException
Message: One or more items in the batch are in pending state..
Parameter name: items
Source: Sitecore.Framework.Conditions
at Sitecore.Framework.Conditions.RequiresValidator`1.ThrowExceptionCore(String condition, String additionalMessage, ConstraintViolationType type)
at Sitecore.Framework.Conditions.Throw.ValueShouldBeTrue[T](ConditionValidator`1 validator, String conditionDescription)
at Sitecore.Xdb.Processing.Queue.ProcessingPool`1.<CheckInAsync>d__13.MoveNext()
--- End of stack trace from previous location where exception was thrown ---
at System.Runtime.ExceptionServices.ExceptionDispatchInfo.Throw()
at System.Runtime.CompilerServices.TaskAwaiter.HandleNonSuccessAndDebuggerNotification(Task task)
at Sitecore.PathAnalyzer.Processing.BinaryKeyInteractionProcessingPoolScheduler.<MarkProcessedAsync>d__5.MoveNext()

Looking at any change which could cause this, the patch SC Hotfix 487893-1 was applied at the time noted above. What's happening is Sitecore was now able to process records in the GenericProcessingPool table, but there's some with issues fixed by the patch, so they need to be cleared out.
Clearing Out the GenericProcessingPool Table
As said, this table has some bad records so it's going to require a flush. Just to check, I ran the following command:
SELECT count(Id) FROM [xdb_processing_pools].[GenericProcessingPool
Which returned over 600,000 records. Running the following command emptied the table, removing bad records.
Delete FROM [xdb_processing_pools].[GenericProcessingPool]
All that's needed after this is a restart of the processing server, and the errors in Application Insights immediately dropped off.
