

1Feb, 2022
Site Failures and What Else Can Happen When You're Not Monitoring the Health of Your Sitecore Implementation
This week a client had a well-running installation go offline, showing “Error 524: a timeout occurred”. Not having worked on this instance for several months, the first thing I did was look at the logs to see what's going on. At the same time, I asked promotions and campaigns to be paused so we can drop the load on content delivery, since the increase in traffic from about may have caused an issue.
I saw something alarming, and the first thought was, is there no one monitoring this installation? The site is logging thousands of exceptions a day, and one SQL database is pinned at 100% for at least seven days. Ok this happening for several days isn't great but it's running, and the traffic has not increased, so what's new here? Looks at Analytics. it appears xDB is being implemented in a new way that could be an increased demand that is just too much for this configuration.
So, we have three issues to work on: error 524 reported to visitors, the errors in logs, and the SQL spike.
Error 524: A Timeout Occurred
This installation is using Cloudflare in its overall delivery chain, so referencing this was simple. The site is taking longer do deliver content than the allowed limit. Here's an excerpt from their site:
Error 524 indicates that Cloudflare successfully connected to the origin web server, but the origin did not provide an HTTP response before the default 100 second connection timed out. This can happen if the origin server is simply taking too long because it has too much work to do - e.g. a large data query, or because the server is struggling for resources and cannot return any data in time.
It looks like this may resolve itself if we correct whatever is going on with the CD and SQL database.
Resolving Logged Errors
Thousands of these exceptions were being logged each day:
Operation #20, AlreadyExists, Contact {6a2f440d-0790-0000-0000-062176e7c6e4}, ContactBehaviorProfile
Sitecore.XConnect.Operations.FacetOperationException
Sitecore.XConnect.Operations.AddContactOperation: Sitecore.XConnect.Operations.EntityOperationException: Operation #0, AlreadyExists, Contact
Operation #0, AlreadyExists, Contact
Sitecore.XConnect.Operations.EntityOperationException
Ok normally you'd have alerts or someone checking in on logs so this would be addressed, but that wasn't happening in this case. Luckily a simple patch kind of fixes the issue.
After installing this patch, I saw a decrease in exceptions, but they weren't totally gone.
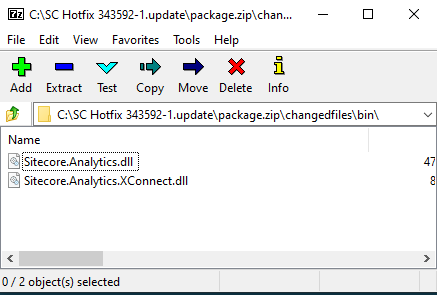
So, here's the catch. It's not documented, but the patch's assemblies need to be deployed to the content delivery instances as well. Normally I follow patching instructions to the letter, but after speaking with support it seems this needs to be done as well. To deploy these files, get them from SC Hotfix 343592-1.update/package.zip/changedfiles/bin/ folder.
Once installed the issue is resolved.
Now, on to….
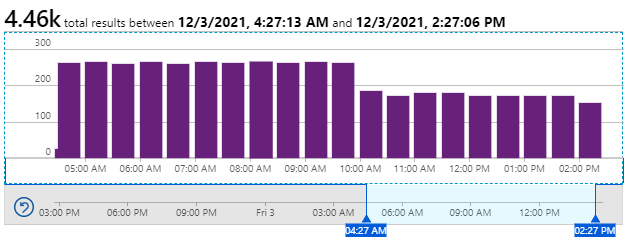
Shard DB at 100% CPU for Several Days
Drilling into the SQL Server, I see that one of the two xDB collection shards are pinned at 100% for as far back as I can see. This could be a known issue, so let's get querying!
This query will get you contacts by interaction count.
SELECT TOP (100) ContactId, COUNT(ContactId) as Count
FROM [xdb_collection].[Interactions]
GROUP BY ContactId
ORDER BY Count DESC
Shard0 didn't have much to tell, but Shard1 had the following, by ID then count:
- 2c8ec1c8-1e03-0000-0000-063ee209d7bc - 93999
- 0dabc41b-2e58-0000-0000-062f7b2d19be - 45221
- 2c8ec1c8-1e03-0000-0000-063960f7c87e - 11098
- 2c8ec1c8-1e03-0000-0000-06396a4f78d0 - 9241
The next thing to do is run a query showing the interactions for these contacts.
SELECT TOP (100) *
    FROM [xdb_collection].[Interactions]
    WHERE ContactId = 'E8CFE92F-70BC-0000-0000-05FA92BFFCA8 '
On reviewing the above contacts, I see the start and end times are identical. I know that bot detection is running and the UserAgent in these records are ok. All interactions are very old so I'm making the decision to remove them.
Analytics Database Manager to the Rescue
Analytics Database Manager is a fantastic tool, and I recommend it's installed in your environments before you need it. There are times you might need this tool quickly, so it's best to be prepared. I'm going to walk through installing and using ADM for version 9.1.1, which is what we have an issue with today.
The zip that has ADM will contain the following:
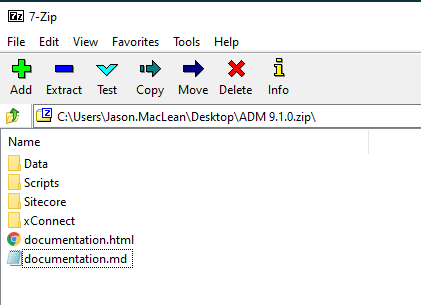
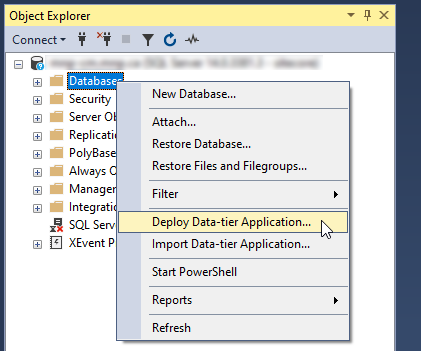
The first thing is to deploy the data\ADM.Tasks.dacpac file, using Deploy Data-tier Application.
This will give you a database named “ADM.Tasks”. You can get the connection string for this new database and set it aside since you'll need that.
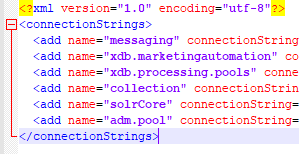
Next, you'll want to open the content management's ConnectionStrings.config file and get the location of the “xconnect.collection” location and FTP to it.
Once connected, edit the xconnect\App_Config\ConnectionStrings.config file and add the new connection string from the last step, naming it “adm.pool”.
Drop the files from the xConnect folder into this instance. It's a bunch of configs and three assemblies.
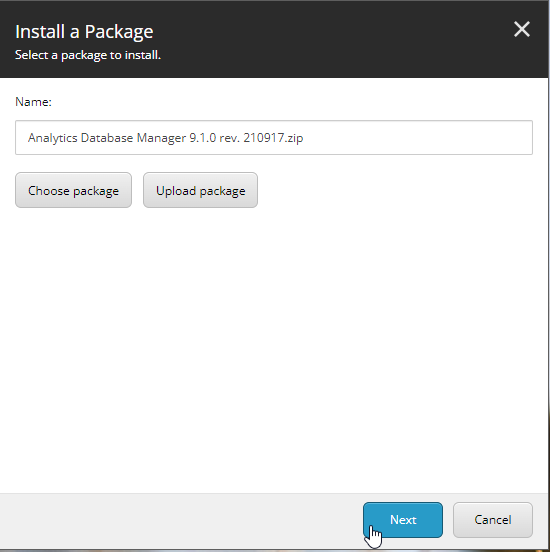
Log in to your content management instance and install the Analytics Database Manager 9.1.0 rev. 210917.zip package as you would with anything else.
The last thing to do is run some scripts provided in the scripts folder. On each shard you'll want to run CreateADMStoredProcedures.sql. CreateMAStoredProcedures.sql is executed on the Marketing Automation database, and if you're using Managed Cloud that's the one ending in “-ma-db”. Finally, the CreateProcessingPoolStoredProcedures.sql script is run on database sending in “-pools-db”.
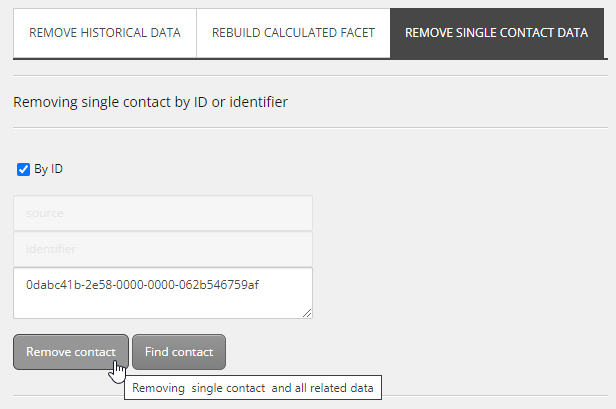
Removing Contacts Using Analytics Database Manager
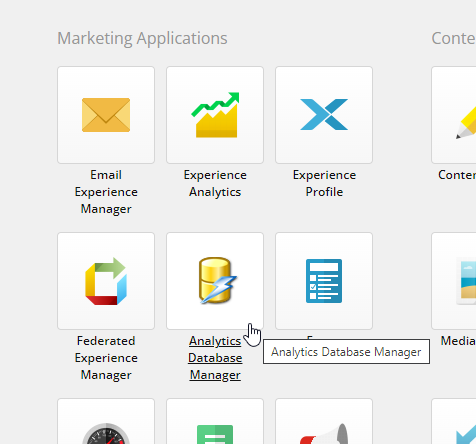
Ok we're near the end. You'll find the ADM option under Marketing Applications in Content Management.
Since we already know the offending contacts, choosing the option of “Remove Single Contact Data”.
Since we're dealing with a lot of data you might use the “Update process history” button to check in on things.
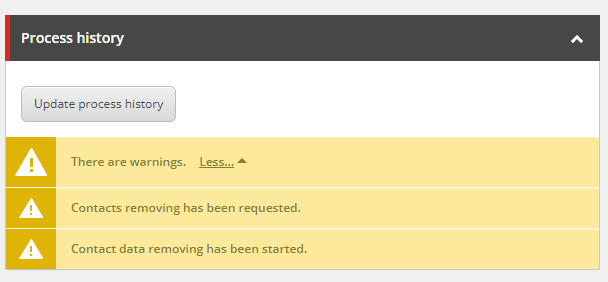
Once complete you'll get the final ribbon that the task is complete.

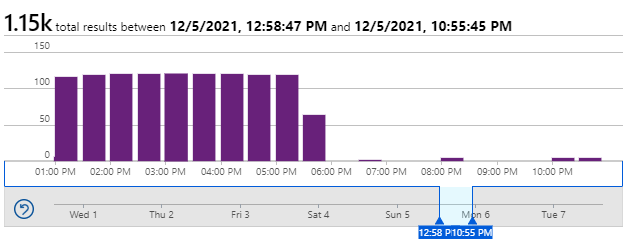
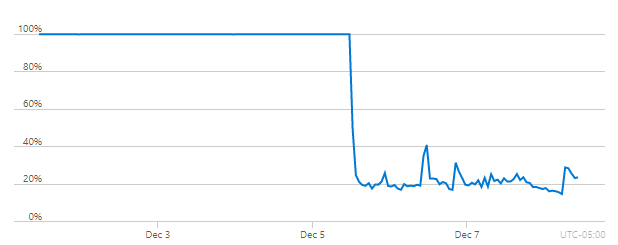
Once the contacts are removed, we see a steady decline in demand on these databases.
A Final Note on Azure Utilization Views
If you're using Azure, you'll see Aggregation type is “Max” by default and understanding that is a little tricky.

When set this way, the graph is showing you the maximum amount of utilization, measured per second, for a whole minute. So, if you are averaging 20% for 59 seconds and 100% for 1 second, that minute will show 100%, which can be deceiving. Using the “Avg” setting here is recommended for less heart attacks and spilled coffee.